Category:
Resolution:
Resolved
The project storage section for usage overview displays a graph with a percentage for the amount of storage used. Although the values above the graph are correct, the graph itself shows 100%.
e.g.
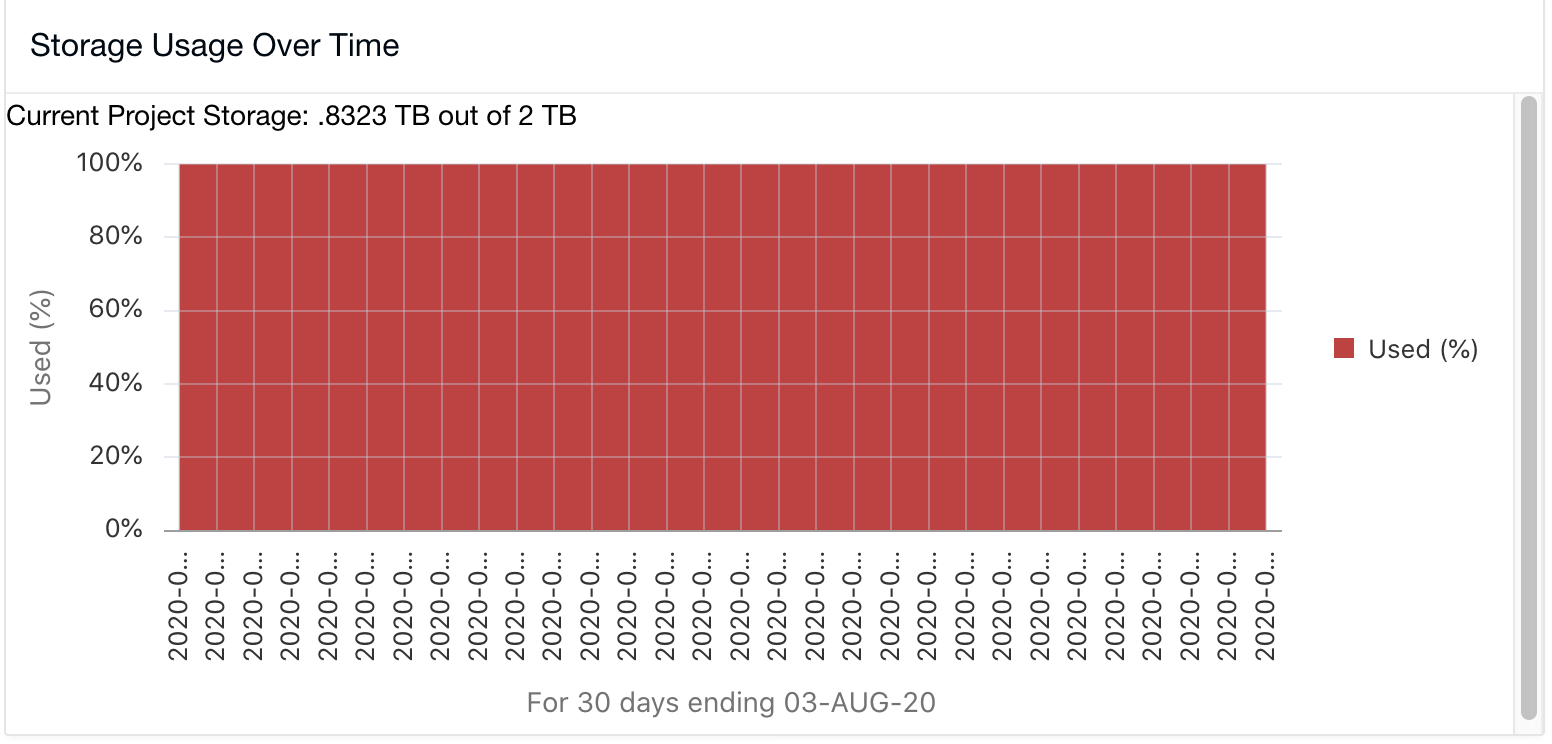
This graph can be seen by selecting usage details of a project on the dashboard or selecting usage overview from the project details page.