The graph below shows the relationship between IBI and the maximum biochemical oxygen demand level (BOD). Notice that the X axis has a label which shows both place and time. The last two digits represent the year and the first five digits represent the place. You can therefore see how each place changed over time as well as how the IBI and BOD are related. Study the graph and answer the questions. Be prepared to explain the correct answers to your group.
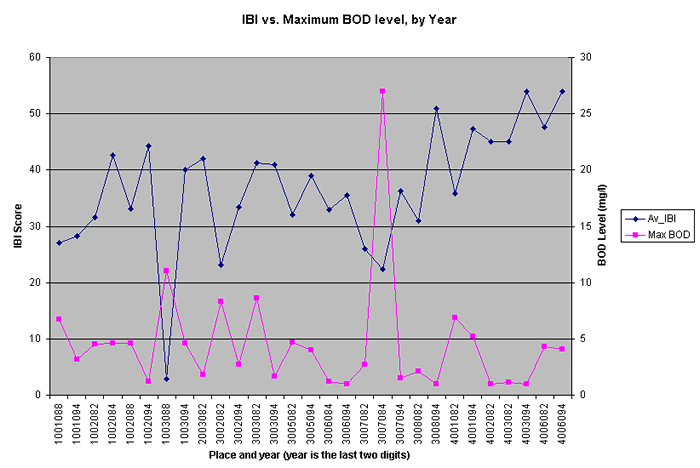
- Describe the relationship between BOD and IBI - as BOD goes down, the IBI ??
- Are there places/times where the relationship does not seem to be consistent? Write those down.
- Look at the points representing the same place at different times. What happened to the BOD levels in more recent years?
- The reason that the IBI and BOD are related in this way is because (choose the best answer):
 - The fish are bigger in some areas and create more organic wastes.
 - When the BOD is high, there is more oxygen in the stream for the fish and other species to use.
 - The higher the BOD, the more oxygen will be used to decompose the wastes lowering the oxygen available to fish.
 - Fewer trees in the riparian zone increase the BOD level and make the habitat worse for fish.


- The two main sources of BOD loads in Ohio streams are:
- Sewage treatment plants and animal wastes. - Animal wastes and leaf litter from the trees along the streams. - Leaf litter from the trees along the streams and the sediment on the stream bottom. - Air pollutants that are washed into the stream by rainfall and ground water.
|
|
|