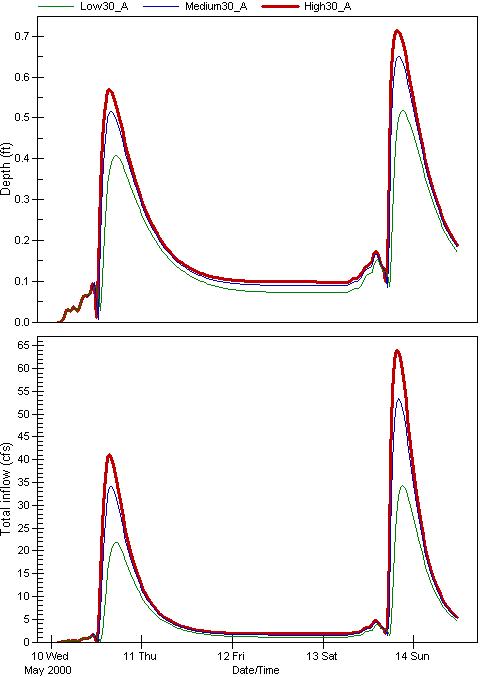
This scenario shows the water depth and water inflow hydrographs at the mouth of the stream for the scenario you selected. It compares the amount of runoff for the three types of urban development – low density, medium density, and high density. Record the data as instructed. Then you can click on the links to observe the impacts on water quality and to play the flood animation.
High Density Urban Land Use Scenario: